
Download Ultimaps – Interactive Map Visualization Tool for Windows, Mac, Android & iOS
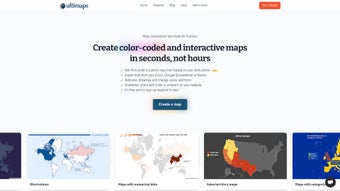
Ultimaps is a powerful, user-friendly web application that transforms complex spatial data into stunning, interactive maps. Whether you're a data analyst, educator, or business professional, Ultimaps simplifies the process of visualizing geographic information with color-coded, customizable maps. The platform supports seamless data import from Excel, Google Sheets, and CSV files, enabling quick mapping of sales territories, population trends, or customer locations.
With advanced customization tools, you can adjust colors, add pins, draw shapes, and modify fonts to match your brand or presentation style. Every map comes with an interactive legend, tooltips, and pop-up windows that provide real-time insights. Ultimaps automatically assigns color gradients based on your data, ensuring clarity and visual impact.
The app is fully responsive, making it accessible on desktops, tablets, and smartphones. Projects are saved automatically, so you never lose your work. With a free plan and a Pro subscription for advanced features, Ultimaps is a secure, scalable solution for anyone needing dynamic map visualization.
Effortless Map Creation with Real-Time Data Integration
Creating interactive maps has never been easier than with Ultimaps. The platform’s intuitive interface allows users of all skill levels to generate professional-grade maps in minutes. The real power lies in its ability to import data from multiple sources—Excel spreadsheets, Google Sheets, and CSV files—without requiring any technical expertise. Once your data is uploaded, Ultimaps automatically analyzes the values and applies a color gradient to geographic regions, making patterns instantly visible. For instance, if you’re mapping sales performance across states, higher values will appear in darker shades, while lower values are lighter. This visual cue helps decision-makers quickly identify trends and outliers. Beyond basic color-coding, Ultimaps offers extensive customization. You can manually adjust the color palette to align with your brand’s identity or use pre-designed themes for a polished look. Adding custom pins, drawing polygons, or inserting text labels enhances the storytelling aspect of your map. Each element is drag-and-drop friendly, allowing for rapid iteration. The tooltip feature is especially useful—hovering over a region displays detailed data, such as revenue figures or population counts, without cluttering the main view. Pop-up windows can include images, charts, or links, turning your map into an interactive dashboard. These features are ideal for presentations, reports, and educational content. The auto-save function ensures your progress is preserved across sessions, so you can return to your project anytime. Whether you're tracking delivery zones or analyzing market penetration, Ultimaps streamlines the entire workflow from data input to final visualization.Seamless Sharing, Mobile Accessibility & Pro Features
One of Ultimaps’ standout strengths is its robust sharing and publishing capabilities. Once your map is complete, you can generate a secure link to share with colleagues, clients, or students. This link can be set to public or restricted access, giving you full control over who views your data. For those integrating maps into websites or blogs, Ultimaps provides an embed code that maintains interactivity and responsiveness across devices. The mobile-friendly design ensures that your maps look and function perfectly on smartphones and tablets, making them ideal for on-the-go presentations or field reports. The free version of Ultimaps is already packed with value, offering unlimited map creation, basic customization, and one public shareable link. However, the Pro subscription unlocks advanced features that significantly enhance productivity. These include the ability to create private maps, access to premium templates, advanced data filtering, and priority customer support. Pro users also benefit from higher data limits and the option to export maps as high-resolution images or PDFs. With regular updates, Ultimaps continues to evolve, adding new tools like heatmaps, time-series animations, and integration with third-party analytics platforms. The software is compatible with Windows, Mac, Android, and iOS, meaning you can work from any device. Security is a top priority—data is encrypted in transit and at rest, and the platform complies with GDPR and CCPA standards. Whether you're a teacher illustrating historical migrations or a marketer tracking campaign reach, Ultimaps delivers a secure, scalable solution.Key Features of Ultimaps
- Import data from Excel, Google Sheets, and CSV files
- Automatic color-coding based on data values
- Customizable color schemes, pins, and annotations
- Interactive tooltips and pop-up windows
- Auto-save and cloud-based project storage
- Public and private sharing options with secure links
- Embed maps into websites and blogs
- Mobile-responsive design for all devices
- Pro features: heatmaps, time-series animations, advanced filters
- GDPR and CCPA compliant with end-to-end encryption
Pros and Cons: Is Ultimaps Right for You?
- Pros:
- Intuitive drag-and-drop interface suitable for beginners and experts
- Fast data import and automatic visualization
- Highly customizable with rich styling options
- Secure, cloud-based storage with auto-save
- Perfect for educators, businesses, and analysts
- Mobile-friendly and embeddable on websites
- Free plan offers strong value for basic use
- Cons:
- Advanced features require a Pro subscription
- Limited offline functionality (web-based only)
- Learning curve for complex animations and filters
- Some users may need additional training for advanced use
- Export options are restricted in the free tier



.png)